Personal learning paths as visual roadmaps
SeOppi 2|2016
Text: Kari A. Hintikka
Personal learning paths as visual roadmaps
Our society is becoming more and more complex. Different issues interconnect in a more complicated way, and in general, seeing cause and effect relationships is more troublesome than earlier.
One of the recent solutions to aid us to see totalities is the visualisation of the interconnection points of issues. Over the past few years, we have seen the emergence of info graphics, which makes complex totalities easily understandable; these include matters such as a certain phenomenon in the different countries on our globe, and the ecosystem of mobile devices and applications.
Different monitoring and visualisation methods have long been a daily matter for those who work in technical maintenance jobs. These methods help us make sense of the totality we are studying while we also see e.g. individual users and their real-time behaviour. This allows us to make estimations and prepare for unexpected events, and we may monitor e.g. budget adherence.
Mobile fitness applications such as Endomondo and Moves are examples of data visualisation in a regular person’s daily life. Such visualisations help us see our progress towards our goals, and we may study the speed of our progress as well as its tenability.
Visualisation helps many matters
The Adaptable Learning Paths Consortium (Poluttamo), funded by the European Social Fund, aims at constructing fluent transitions from studies to working life as well as working life to studies, and combining these in different ways. A key role in this work is given to students’ personal learning paths and the respective guidance activities.
A new national core curriculum was introduced in Finland in 2016 for upper secondary education and basic education; one of the dimensions of this curriculum is the personal learning plan, which is required to be even more diverse than before. The Adaptable Learning Paths project is developing visualised personal learning plans (acronym VOPS) to support student guidance activities.
The schools participating in the project are of various kinds and the studies they offer are not similar. Personal learning plans can be made visual from many perspectives: starting studies, planning studies, the progress of studies, alternative learning paths, what professions and further educations the studies make possible. Otava Folk High School is developing its visual personal learning plan format mainly to serve online students at the Nettilukio online high school. Nettilukio online high school is an upper secondary school for adults and it operates totally online except for the matriculation examination.
Adaptable Learning Paths are currently developing several visual personal learning plan formats. We will see one of them in this presentation. Otava Folk High School is presenting the first developer version of the software at the Online Educa Berlin 2016. The design of the software is carried out by online counsellors Saara Kotkaranta and Anna Harmaa and concept and usability designer Kari A. Hintikka.
Most of the students at Otava Folk High School are distance learners. The interaction between a student and the online counsellor takes place mainly through the internet. The software helps them form a clear, common basis for their discussions on the current situation and the way forward.
At the beginning of their studies, students complete background information forms. They let the school know which level mathematics they intend to undertake, which languages they intend to study, whether their only goal is to gain an upper secondary education and pass the matriculation examination, and if they have prior studies that could be accredited.
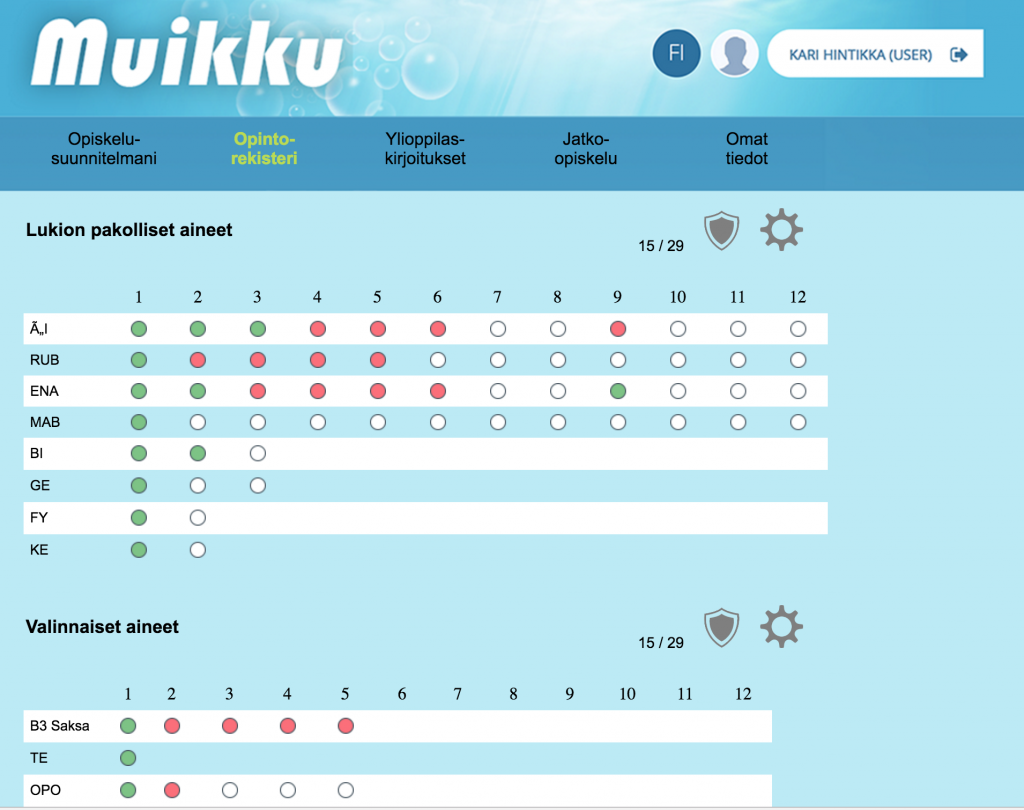
These selections form the basis for their visual personal learning plans. The visualised learning paths tailor themselves automatically to show only those issues that are relevant for the respective students. For example, students’ language selections keep their progress views from containing extra languages or courses. Naturally, selections may be changed during studies.
Upper secondary studies can be classified in several ways. At the national level, they may be compulsory, optional or supplementary. Students may enter diverse information: objectives at different levels, courses they must take, courses they would find interesting, and courses that would benefit them regarding their further education.
Different colours help students see at a quick glance their accomplishments and the courses they have completed. Considering students with sensory impairments, the Otava Folk High School visual personal learning plan system will include symbols in different shapes in addition to those in colours.

Illustration: Otava Folk High School visual personal learning plan system, early draft in Finnish. Legend: Opiskelusuunnitelmani –My personal learning plan Opintorekisteri – Study register Ylioppilaskirjoitukset – Matriculation examination Jatko-opiskelu – Further studies Omat tiedot – My data Lukion pakolliset aineet – Compulsory subjects in upper secondary education Valinnaiset aineet – Optional subjects
Real-time career modelling
When studies commence, students see their progress in units of different colours and shapes. The first developer version of the software focuses on the progress of individual courses, but if students ask, they can be offered diverse data visualised similarly to mobile fitness applications. Students might be shown, for example, their weekly or monthly study cycles such as the times of day they typically study, on which days of the week they study, and for how long they do so. Students could set target times for themselves, and the system could inform them of their progress similarly to fitness applications.
Creating these solutions, we must note that seeing one’s progress in studies easily does not necessarily encourage all students – for some, the case may be the opposite. Therefore, these solutions are designed to support personal learning paths and the freedom of choice.
On the other hand, online counsellors are able to draw a large number of conclusions concerning students’ upcoming progress by analysing their study data. The data can be compared to that of other students and previous students, and all this can be made more visual than the traditional lists used for statistics.
When students’ studies progress, the system enters the next phase, which is that of completing secondary education and/or taking the matriculation examination. At this time, the system helps students’ time and work planning.
The focus areas of the European Social Fund include fluent transfers during the programme period until 2020. The visual personal learning plan system could be applied to making diverse models for students’ further studies and career options.
Finland currently funds an online service called Studyinfo.fi, which is maintained by the Finnish National Board of Education. Finnish schools and universities maintain data of their educational programmes in the service. People may browse the site to learn about different professions and degrees and about the places where these degrees may be taken; they may also learn about the entry criteria and apply for programmes.
Studyinfo.fi offers an open application programming interface. It would be possible to use the Studyinfo.fi interface to compare automatically, in real time, the courses completed and planned by a student to the entry criteria required by the educational programmes in the field of that student’s choice. With the visual personal learning plan system and Studyinfo.fi interfacing, students could see what is required of them in order for them to apply for a certain educational programme and a certain school. With a dynamic visual personal learning plan system such as ours, students and counsellors could together guide students’ personal learning paths into the desired directions, making personal roadmaps to guide studies.


